
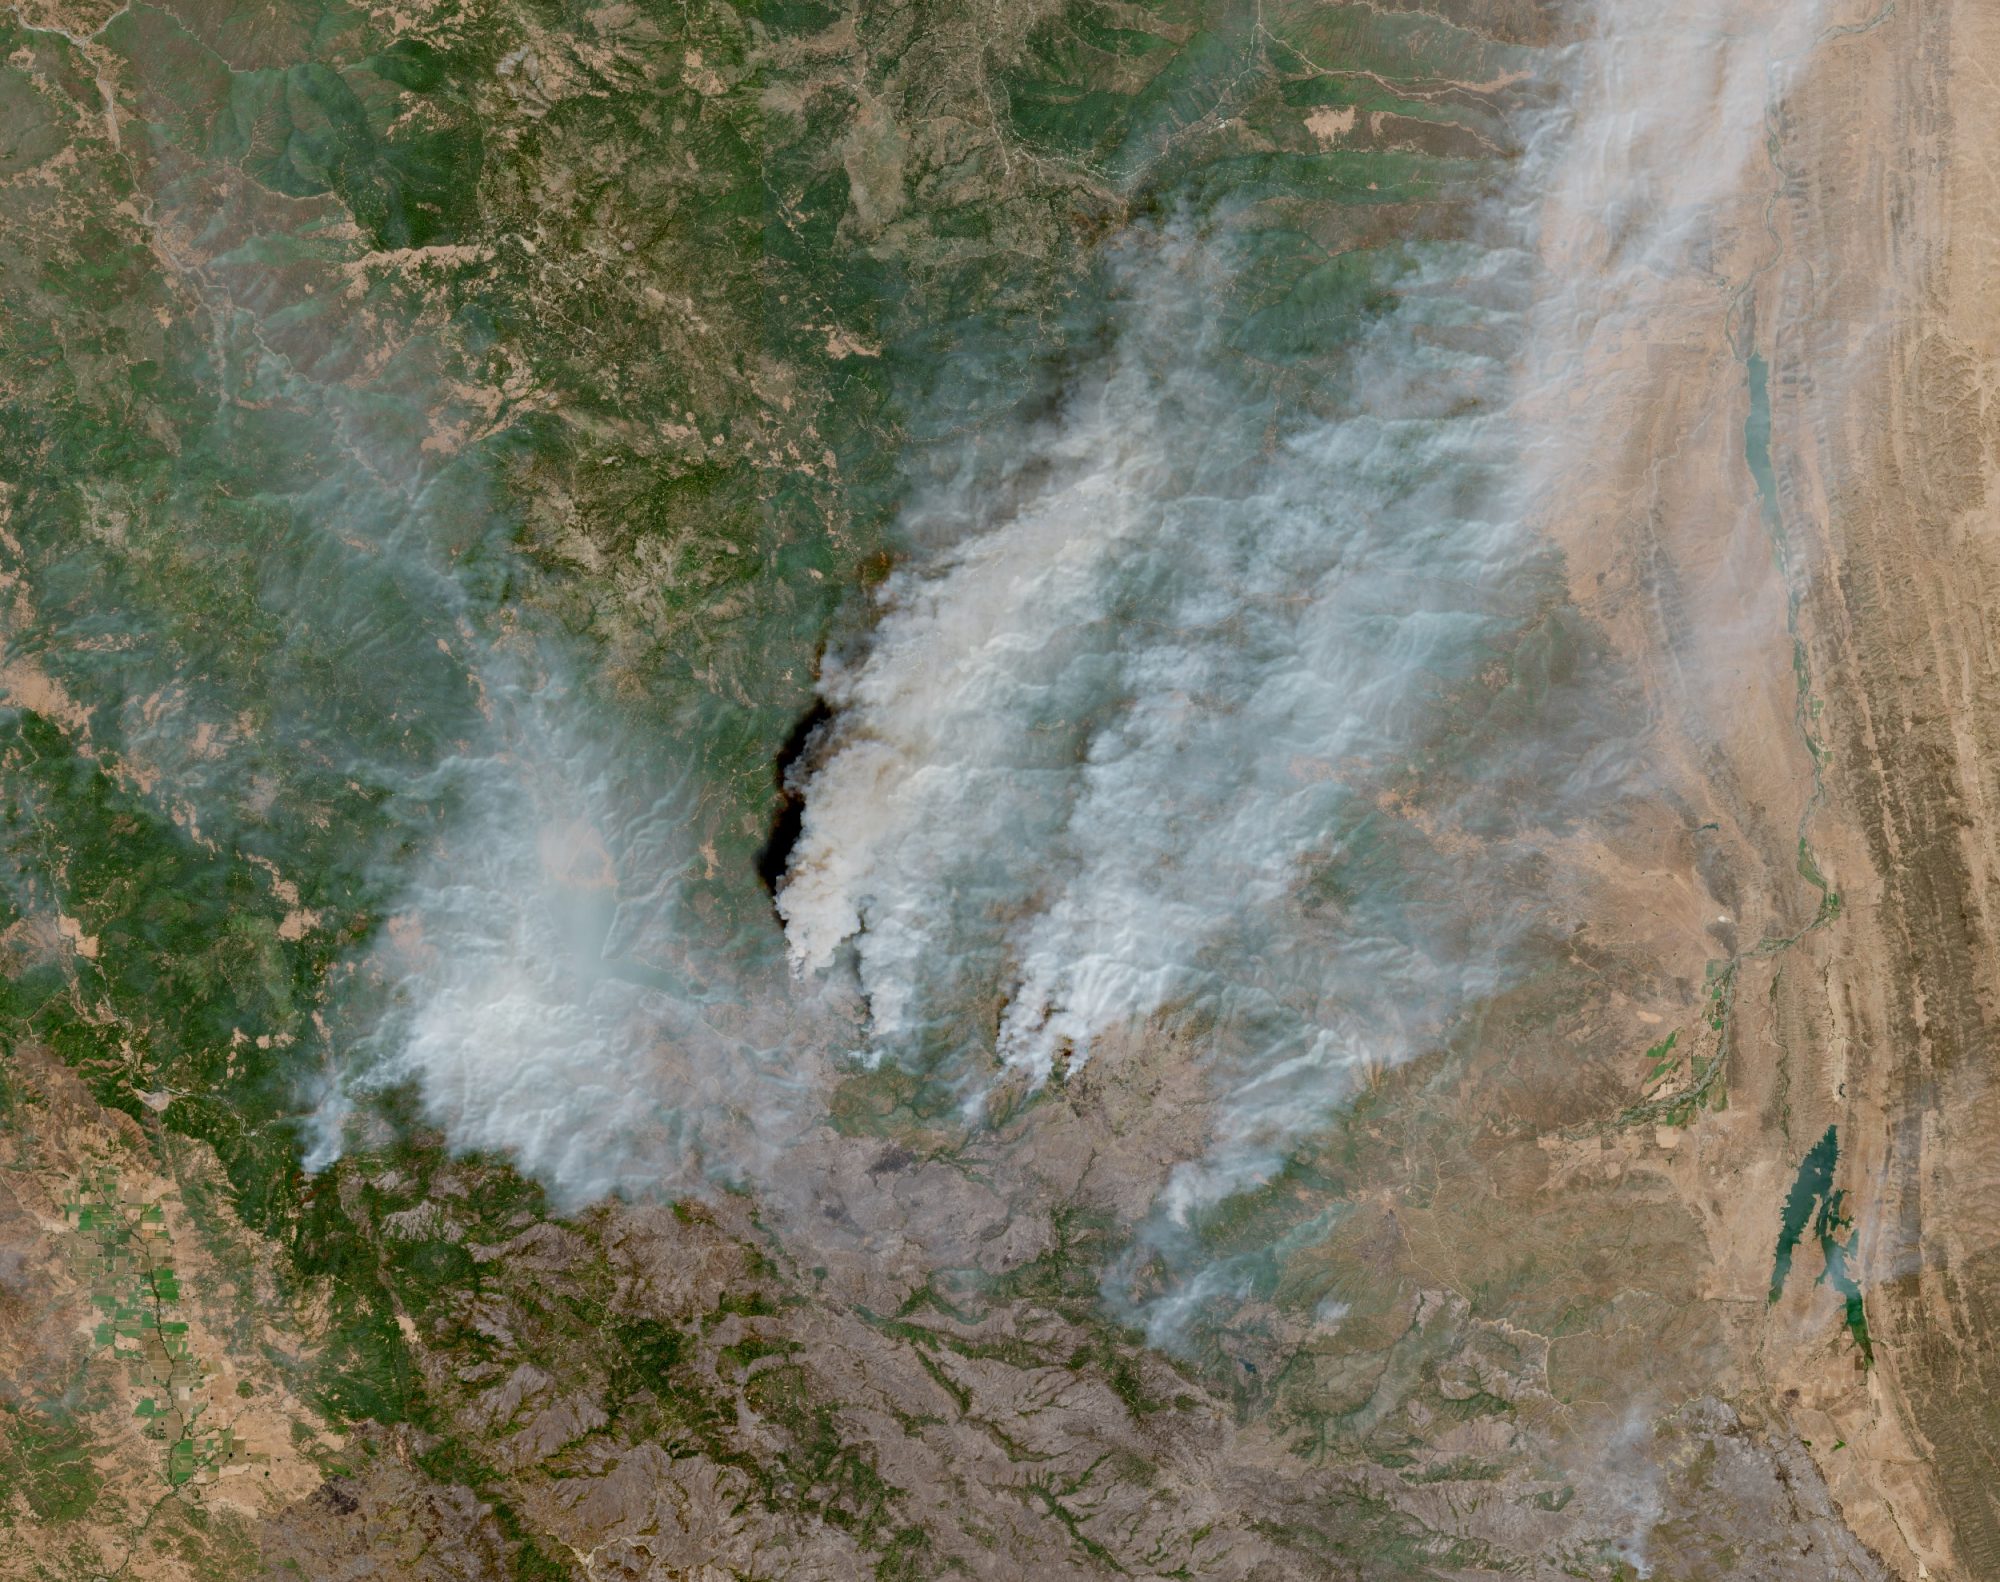
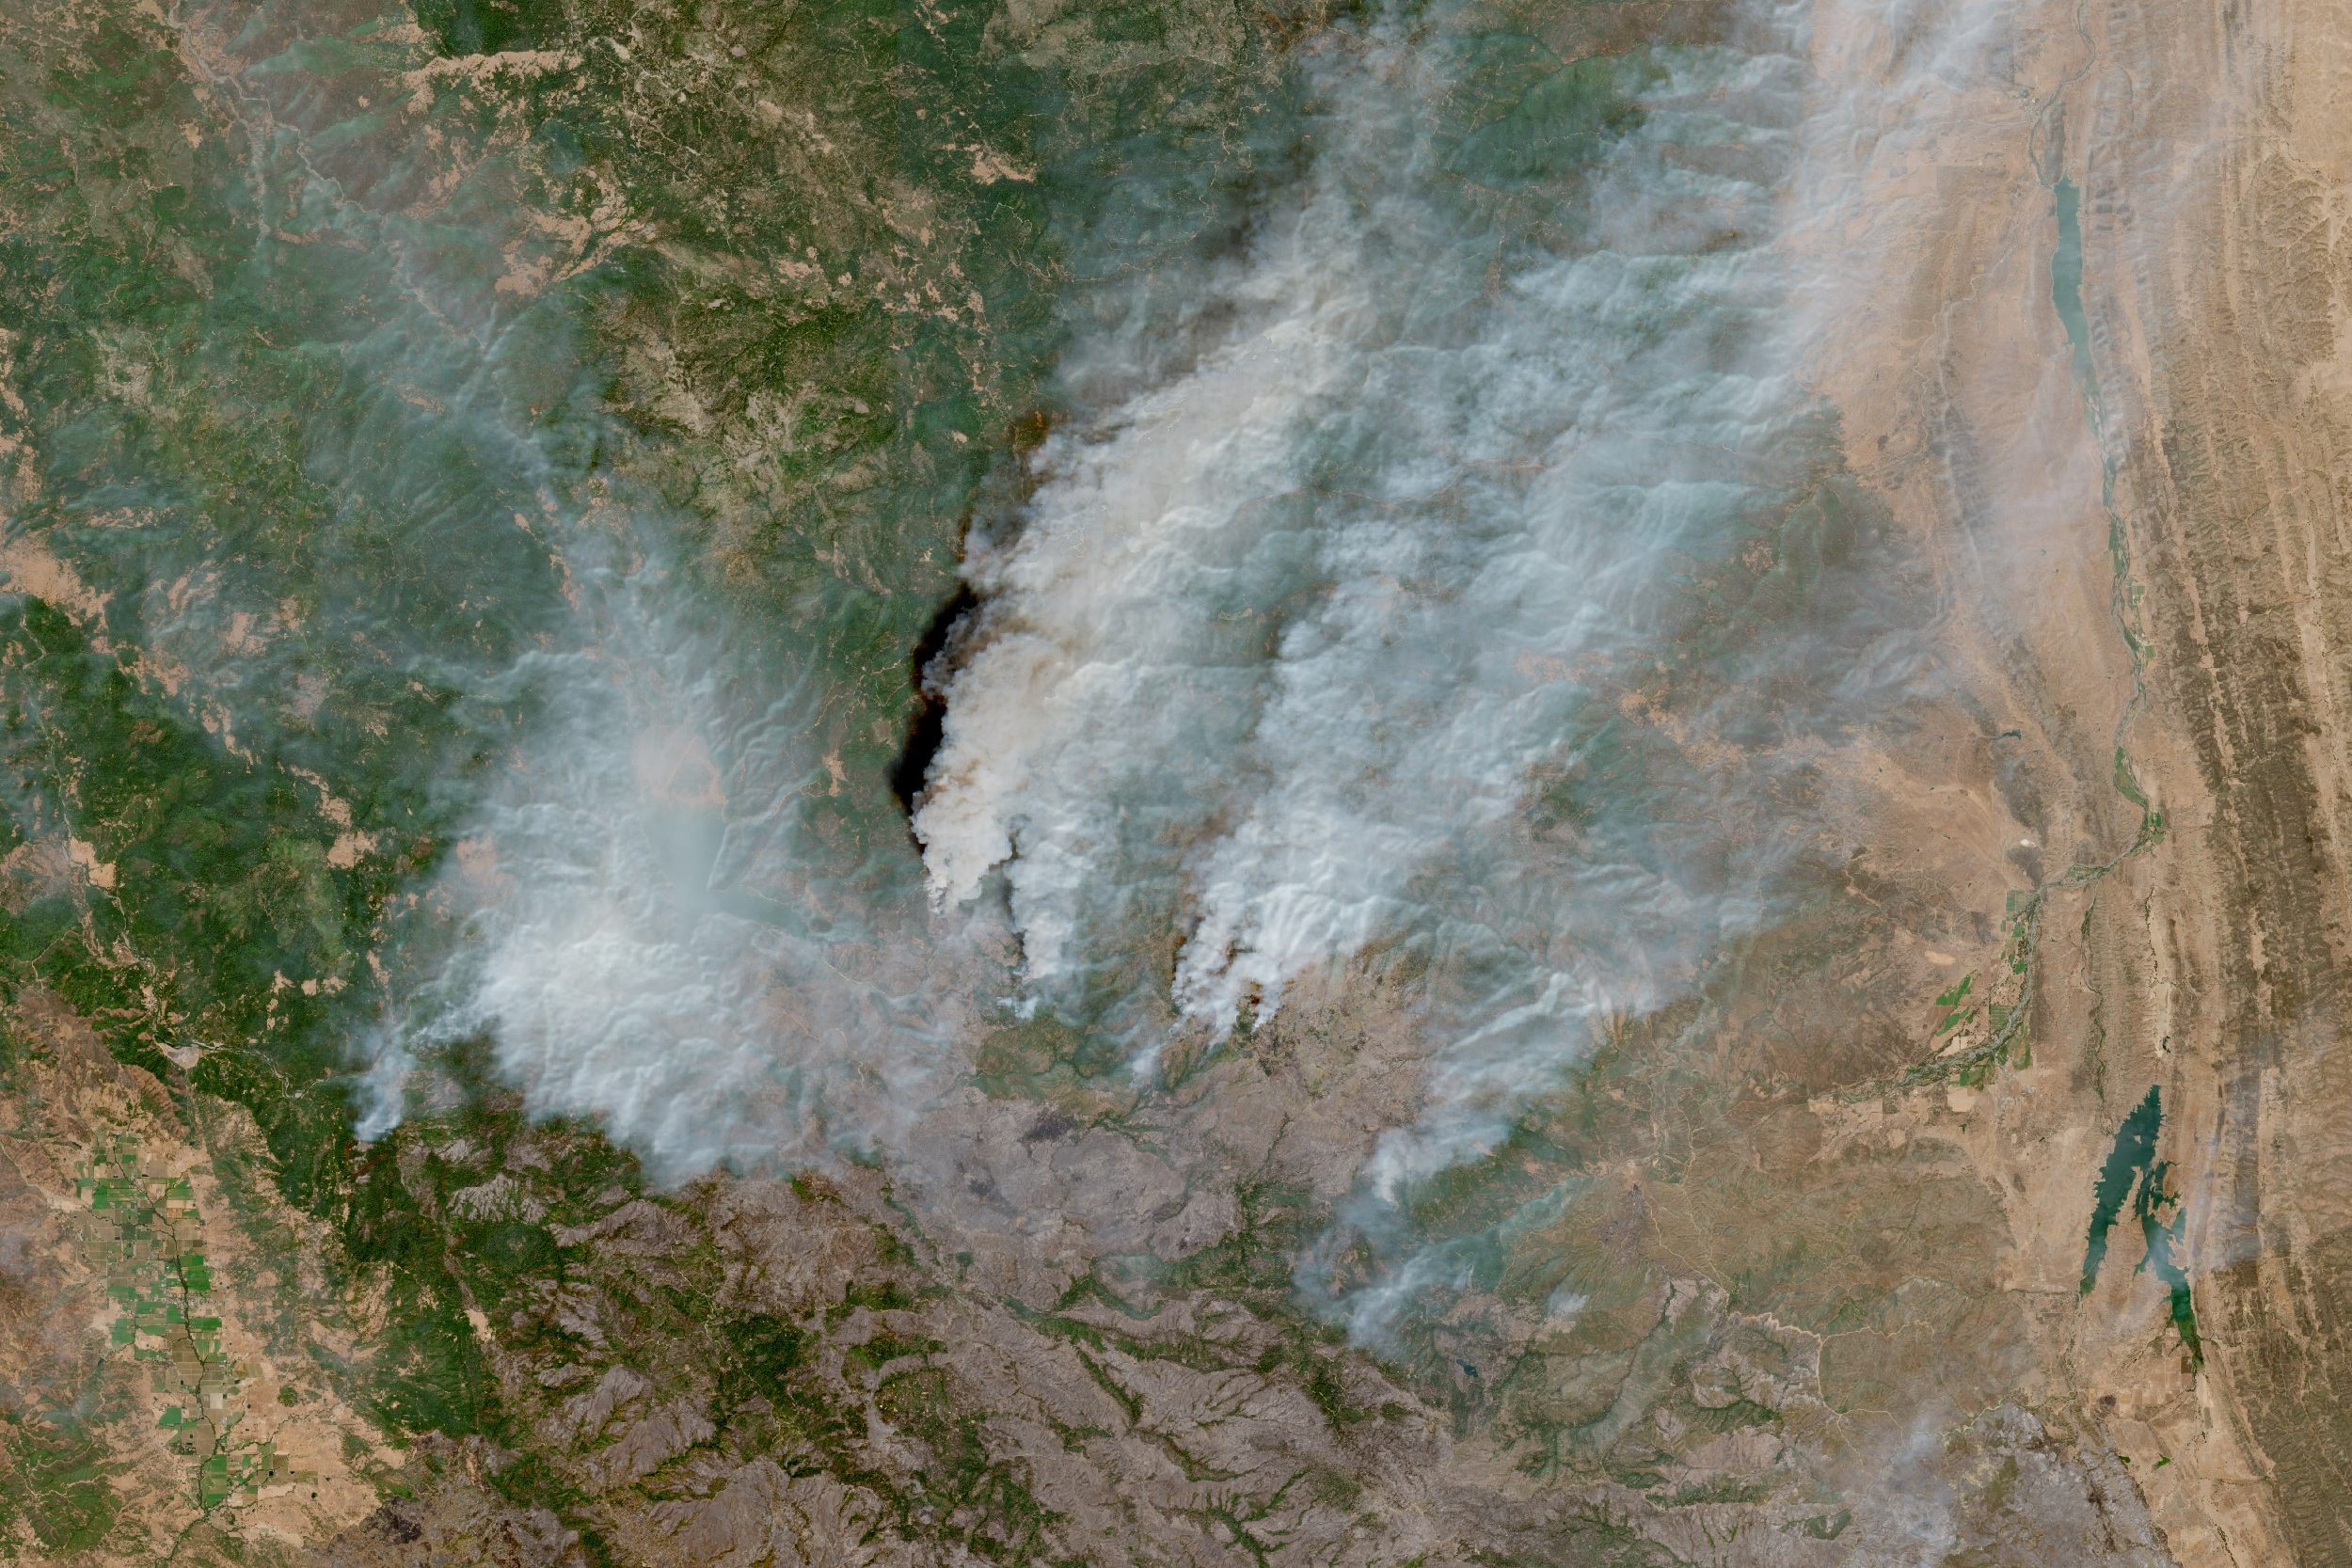
Developed an interactive ArcGIS StoryMap documenting the 2018 Mendocino Complex Fire entrapment on the Ranch Fire. The project combines GIS analysis, historical imagery, operational maps, and a guided narrative to reconstruct the incident and communicate lessons learned.
Key Outputs
- Interactive ArcGIS StoryMap
- ArcGIS Online Web Maps
- Custom map design
- Historical fire progression visualization
- Interactive photo locations and incident timeline
ArcGIS StoryMap Workflow
1. Research & Source Collection
- Obtain official reports (SAIT, FLA, etc.)
- Collect maps, photos, radio logs, and timelines
- Organize files by source
2. GIS Data Preparation
- Import incident perimeter
- Create project geodatabase
- Acquire terrain, imagery, roads, hydrography
- Verify coordinate systems
- Clean and organize datasets
3. Feature Creation
- Event points
- Operational divisions
- Fire progression
- Crew movement
- Reference labels
- Photo locations
4. Cartography
- Design consistent symbology
- Configure scale visibility
- Create labeling hierarchy
- Build popup content
- Optimize for AGOL
5. ArcGIS Online
- Publish feature layers
- Configure web maps
- Set bookmarks
- Configure layer visibility
- Configure popups
- Optimize for mobile
6. StoryMap Development
- Build narrative outline
- Create Sidecar sections
- Embed maps
- Add Map Tours
- Add images and captions
- Sync map extent with narrative
7. QA/QC
- Desktop review
- Mobile review
- Verify links
- Verify imagery
- Check performance
- Correct typos and inconsistencies