
Overview
This project demonstrates how remote sensing and GIS can be used to analyze wildfire progression, burn severity, and vegetation change over time. Using satellite imagery, hotspot detections, and geospatial analysis, the workflow visualizes how the Caldor Fire expanded, where impacts were most severe, and how vegetation conditions changed before and after the event.
Objectives
- Visualize wildfire progression using time-enabled hotspot data
- Quantify vegetation loss using spectral indices
- Map burn severity across the fire area
- Deliver results through an interactive web map and StoryMap
Key Outputs
- Time-enabled wildfire progression web map
- NDVI pre- and post-fire vegetation change
- dNBR burn severity map
- Interactive StoryMap narrative
- ArcGIS Dashboard for supporting analysis
- Instant App (Slider) for hotspot progression visualization
Workflow
Data Preparation
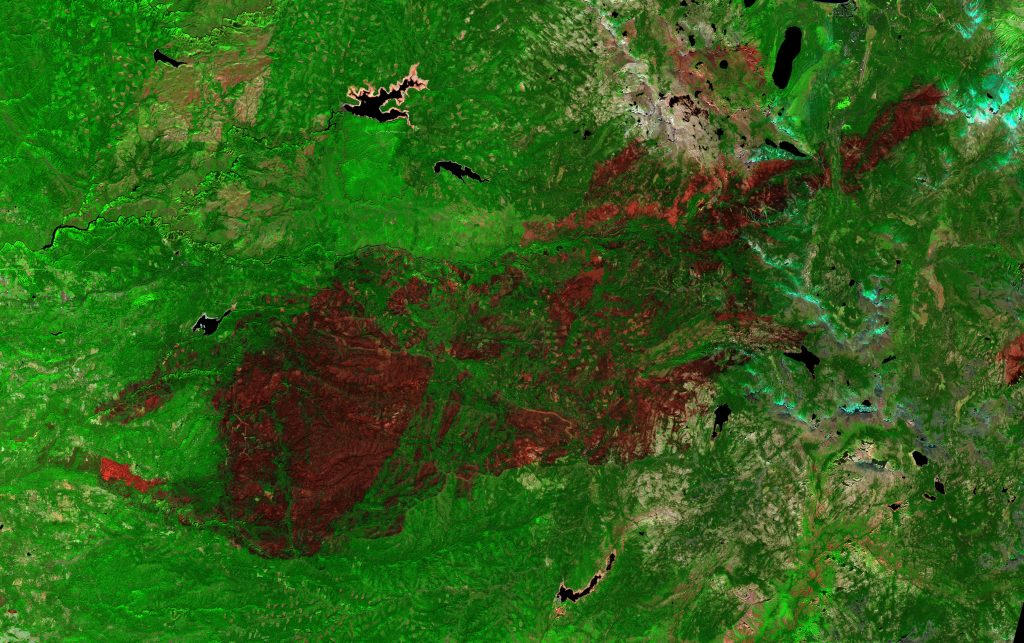
Sentinel-2 imagery was downloaded as multiple tiles covering the study area. Scenes were reviewed to remove cloud-contaminated and no-data regions, then mosaicked into a single continuous raster. This ensured consistent spatial coverage and minimized seamline artifacts for downstream analysis.
Fire Progression
Hotspot detection data was processed and configured as a time-enabled layer to visualize fire growth over time. Initial time configuration in ArcGIS Online produced inconsistent results due to field formatting and schema limitations. The dataset was reprocessed in ArcGIS Pro to correctly define date-time fields, then republished to ArcGIS Online, enabling accurate time slider functionality and day-by-day visualization of fire progression.
Vegetation Change (NDVI)
Vegetation conditions were analyzed using the Normalized Difference Vegetation Index (NDVI) derived from Sentinel-2 imagery.
NDVI was calculated using:
- Band 8 (Near-Infrared)
- Band 4 (Red)
NDVI = (B08 − B04) / (B08 + B04)
Healthy vegetation reflects strongly in the near-infrared and absorbs red light, producing higher NDVI values. By comparing pre- and post-fire NDVI rasters, areas of vegetation loss were identified as reductions in NDVI values, highlighting the spatial extent of fire impact.
Burn Severity (dNBR)
Burn severity was mapped using the Differenced Normalized Burn Ratio (dNBR).
First, the Normalized Burn Ratio (NBR) was calculated:
NBR = (B08 − B12) / (B08 + B12)
Where:
- B08 = Near-Infrared (NIR)
- B12 = Shortwave Infrared (SWIR)
The dNBR was then derived:
dNBR = NBR_pre − NBR_post
Higher dNBR values indicate greater burn severity due to reduced vegetation and increased soil exposure. The resulting raster highlights spatial patterns of fire intensity across the landscape.
Web Mapping & Presentation
Final datasets were published to ArcGIS Online and delivered through multiple web products, including an interactive web map, StoryMap, Dashboard, and Instant App.
The Instant App (Slider) was used to visualize hotspot progression over time, allowing users to compare fire activity across different dates. The StoryMap provides a structured narrative of the analysis, while the Dashboard supports interactive exploration of fire activity and supporting data.
Together, these applications allow users to explore fire progression, compare vegetation conditions, and examine burn severity in an intuitive, interactive environment.
Tools & Technologies
- ArcGIS Pro
- ArcGIS Online
- ArcGIS StoryMaps
- Raster analysis and map algebra
- Remote sensing change detection
- Time-enabled web mapping
Data Sources
- Sentinel-2 multispectral imagery
- Satellite-derived hotspot detections
- Fire perimeter data
- RAWS weather station observations
- Derived raster products (NDVI, NBR, dNBR)
Why This Project Matters
Wildfires are driven by terrain, fuels, and environmental conditions that vary across space and time. This project demonstrates how remote sensing and GIS can be used not only to visualize wildfire impacts, but to interpret fire progression, burn severity, and vegetation change at landscape scale.
Skills Demonstrated
- Remote sensing analysis
- Raster processing and map algebra
- Change detection techniques
- Wildfire mapping and interpretation
- ArcGIS Online publishing and configuration
- Spatial data visualization and storytelling